Book Appointment Now


Medical Tourism Statistics 2026: Latin America Costs, Market Size & Trends
80+ Verified Stats on Costs, Procedures & Trends
Latin America’s medical tourism market is estimated at $14.61 billion in 2026, with patients from the United States commonly paying 40-80% less for treatment. Mexico is the region’s largest destination by international patient volume, while Brazil leads the region in JCI-accredited organizations. This report brings together 80+ medical tourism statistics covering costs, market growth, patient volumes, procedures and healthcare quality across Latin America.
Last updated: August 2026 · Research period: 2024 to 2026 · Free to cite with attribution
Research & editorial review
Research compiled by the Medical Tourism Packages editorial team using 45+ sources including JCI, WHO, PAHO, national tourism authorities and peer-reviewed medical research. Data last reviewed August 2026.
Data reviewed by Luis Alvarez. IT and Digital Operations Manager at Medical Tourism Packages. Engineer’s degree, Escuela de Ingeniería de Antioquia, with a specialisation in Financial Administration from Universidad de los Andes and over a decade of data analysis and M&A due diligence work across Colombia, Panama, Costa Rica and Mexico. Every figure on this page was checked against its primary source in August 2026.
Quick Stats Dashboard
$58.38B
Market Size by 2034
40-80%
Average Cost Difference
1.2M+
Annual Tourists (Mexico)
#7
Costa Rica Medical Tourism Index Rank
Sources: market size, Market Data Forecast (2026). Cost ranges, Medical Tourism Packages package pricing 2024 to 2026. Patient volume, Global Health Intelligence and Patients Beyond Borders. Medical Tourism Index rank, 2020-21 edition.
Key Takeaways
- Latin America’s medical tourism market is projected to grow from $14.61 billion in 2026 to $58.38 billion by 2034, an 18.9% CAGR.
- US patients pay 40% to 80% less than home prices, reaching 82% below on full-mouth dental restoration.
- Mexico receives 1.2 to 3 million medical travelers a year, the highest volume in the region.
- Brazil leads on quality infrastructure with 75 JCI-accredited organizations, the most in Latin America.
- Colombia: in a study of 460 international plastic surgery patients, 98.2% said they would recommend their clinic to friends and family. In the WHO’s last global health-system ranking (2000), Colombia placed 22nd, ahead of the United States at 37th.
Country Snapshots
Key numbers at a glance. Each country has its own anchor link, for example /latin-america-statistics/#colombia.
Mexico
- 1.2 to 3 million medical travelers a year, the highest in the region
- 19 JCI-accredited facilities; $9.5B health and wellness ecosystem (2025)
- Read the full Mexico medical tourism guide
Brazil
- 75 JCI-accredited organizations, the most in Latin America
- #1 in surgical aesthetic procedures worldwide (ISAPS 2024); $3.7B market (2025)
Colombia
- 98.2% of international plastic surgery patients would recommend their clinic (PRS Global Open, 2020); 9 JCI-accredited organizations
- Targeting $6.3B revenue and 2.8M health tourists by 2032
- Read the full Colombia medical tourism guide
Costa Rica
- Ranked #7 globally on the 2020-21 Medical Tourism Index; industry estimates cite 70,000 medical tourists a year
- 96.4% ten-year dental implant survival in peer-reviewed research; combines medical treatment with wellness recovery
- Read the full Costa Rica medical tourism guide
Panama
- Tens of thousands of medical tourists a year (industry estimates)
- Dollarized economy; Pacífica Salud Johns Hopkins affiliation
- Read the full Panama medical tourism guide
Argentina
- Prices 40% to 80% below US levels, driven by favorable exchange rates
- 15,000 to 20,000 medical travelers a year pre-pandemic (CATM); strong European patient volume
Market Size & Growth Statistics
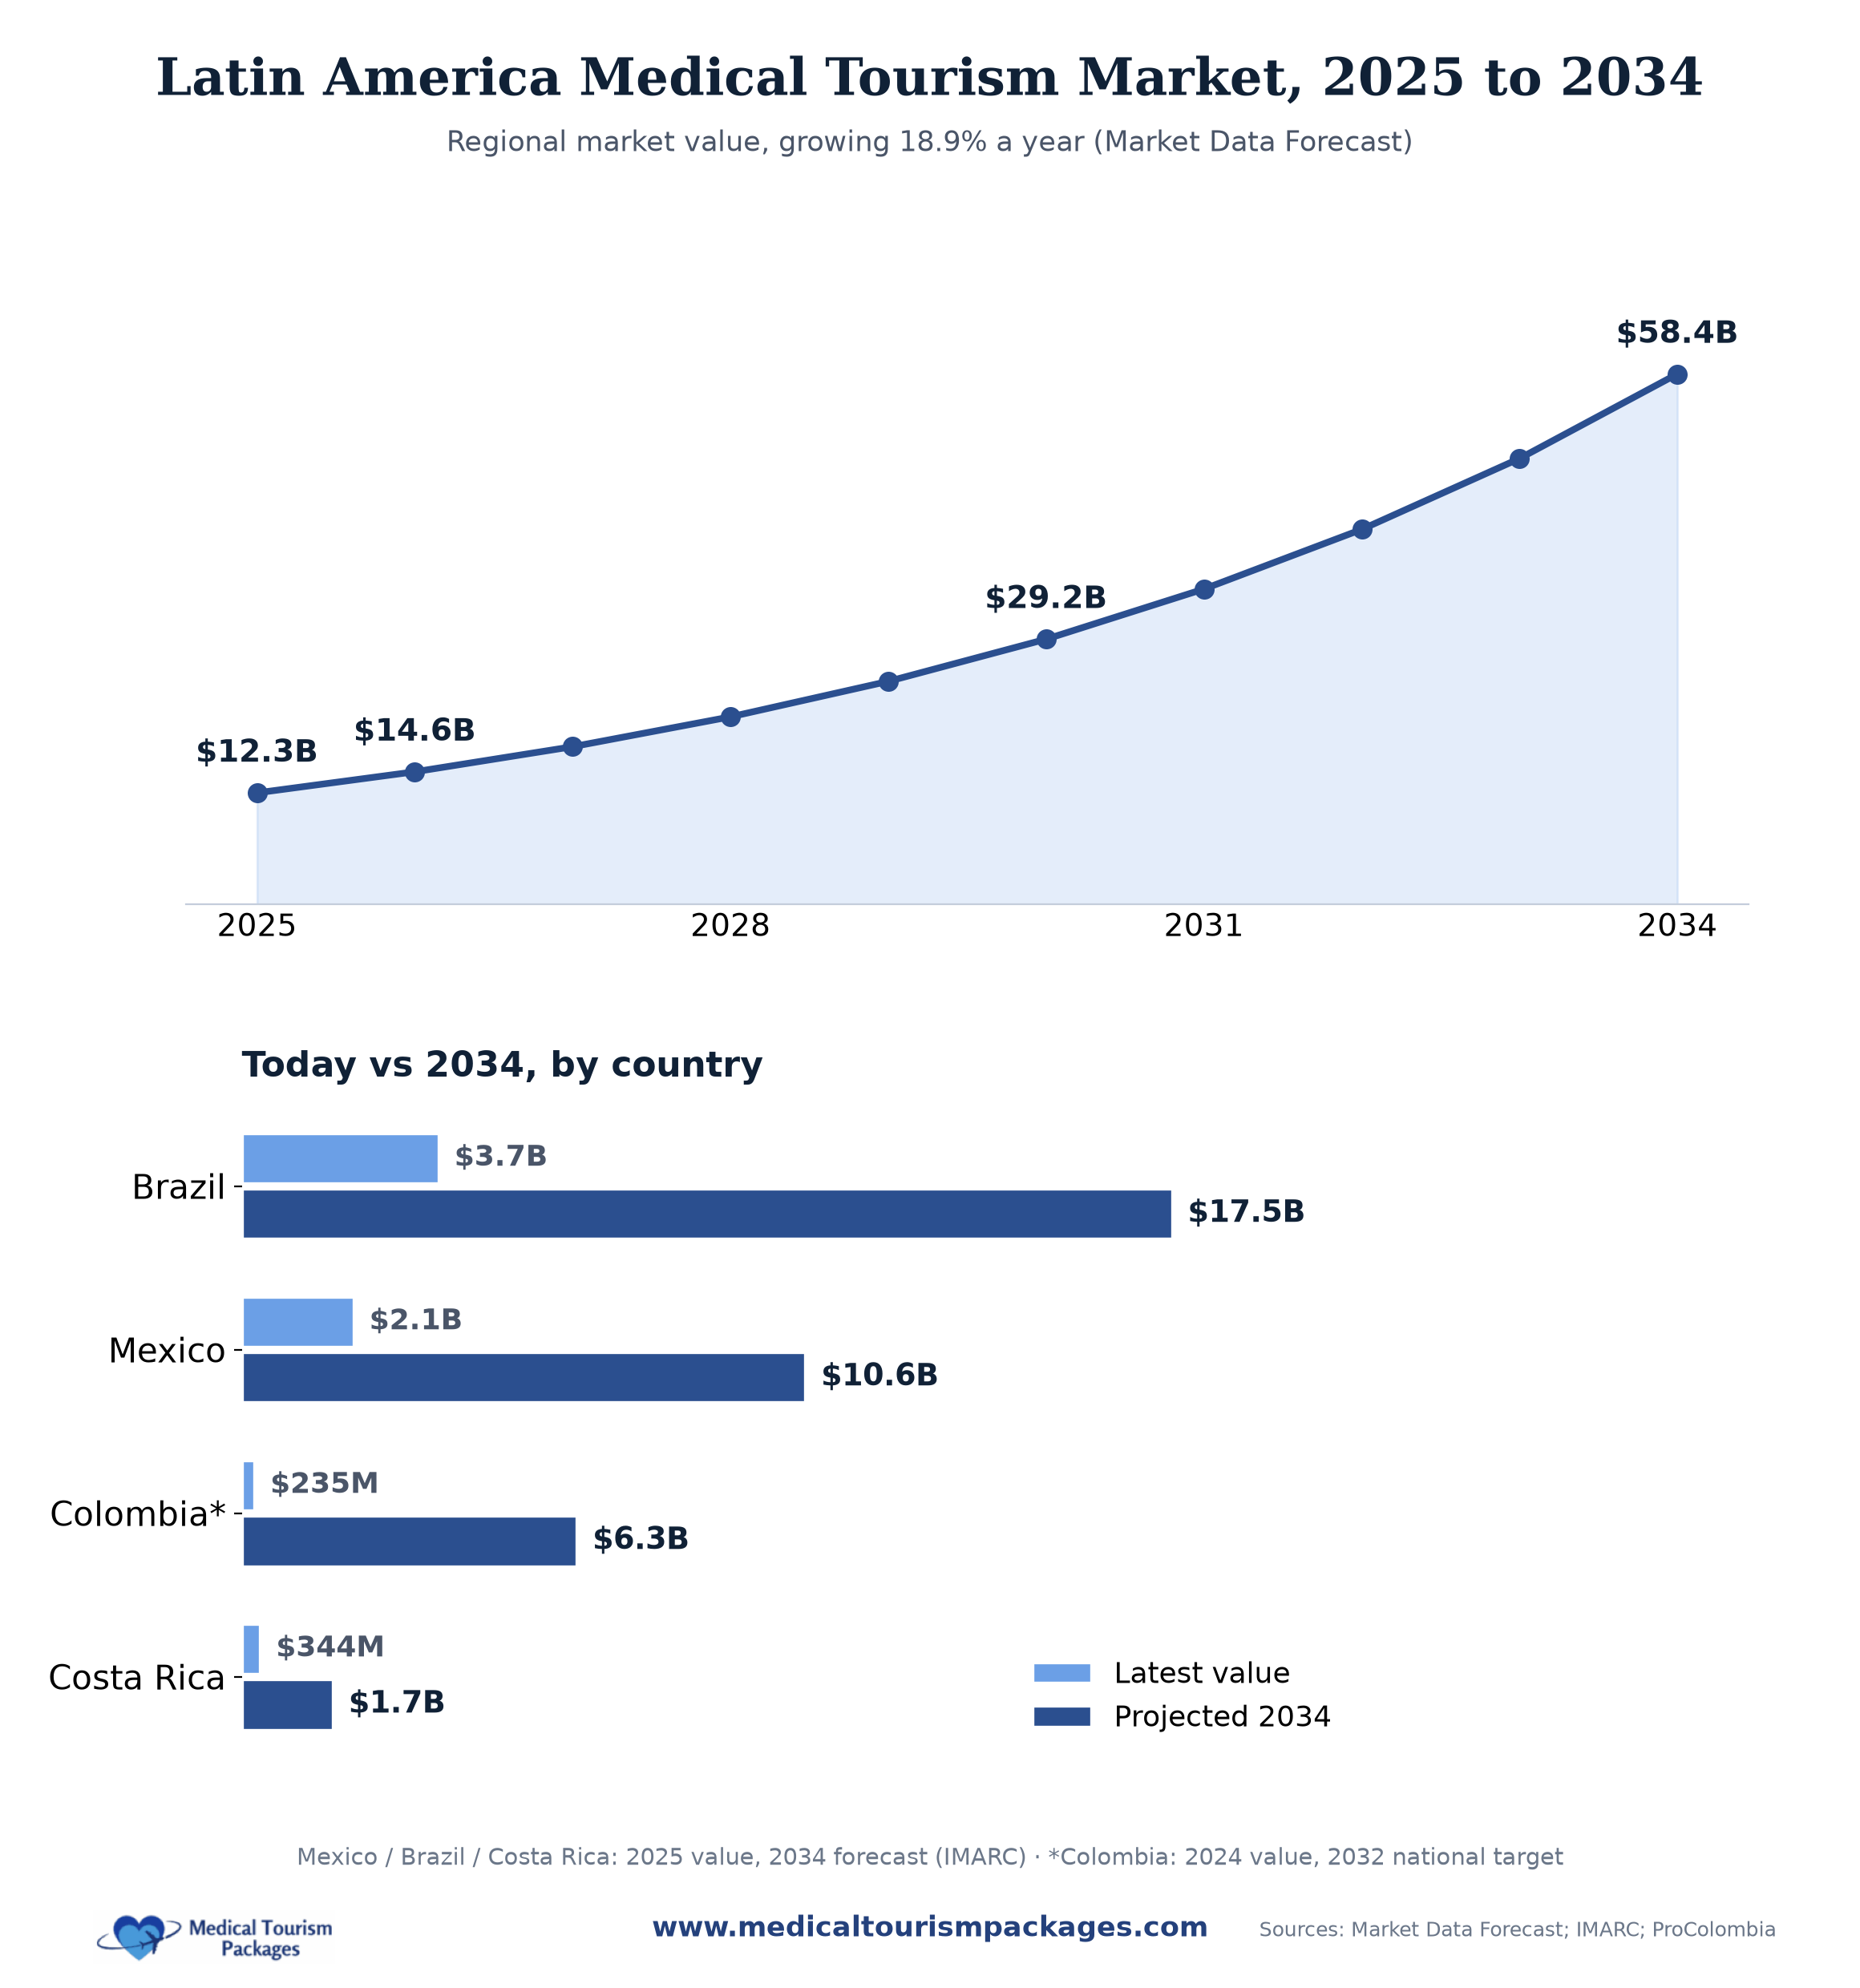
Latin America’s medical tourism market is estimated at $14.61 billion in 2026 and projected to reach $58.38 billion by 2034 at an 18.9% CAGR (Market Data Forecast). This analysis draws on 45+ research sources including JCI, WHO, ProColombia, and national tourism boards.
Overall Latin America Market:
- 2025 market value: $12.29 billion; estimated $14.61 billion in 2026 (Market Data Forecast, 2026)
- 2034 projected value: $58.38 billion (Market Data Forecast, 2026)
- 2026–2034 CAGR: 18.9% annually (Market Data Forecast, 2026)
- Share of global market: about 22% of global medical tourism revenue in 2025 ($12.29 billion of a $55.85 billion global market, Market Data Forecast)
- Note on methodology: research firms define the medical tourism market differently, so their totals are not interchangeable. This page uses Market Data Forecast for both the regional and the global figure so the two stay comparable. Fortune Business Insights, which scopes the market more narrowly, puts Latin America at $3.96 billion in 2025, or 10.4% of its own global total.
By Country (latest market size):
- Mexico: $2.1 billion medical tourism (2025, IMARC Group), within a $9.5 billion health & wellness ecosystem
- Brazil: $3.7 billion in 2025, the largest pure medical tourism market in the region (IMARC Group)
- Colombia: $235 million (2024), projected $6.3 billion by 2032
- Costa Rica: $344.3 million in 2025 (dental & wellness specialization)
- Panama: Tens of thousands of annual medical tourists (dollarized economy advantage)
- Argentina: $250 million annual revenue potential per its medical tourism chamber (favorable exchange rates put prices 40-80% below US levels)
Cost Comparison Statistics (USA vs Latin America)
Dental Procedures: ~70% below US prices
| Procedure | USA Cost | Mexico | Colombia | Costa Rica | Below USA |
|---|---|---|---|---|---|
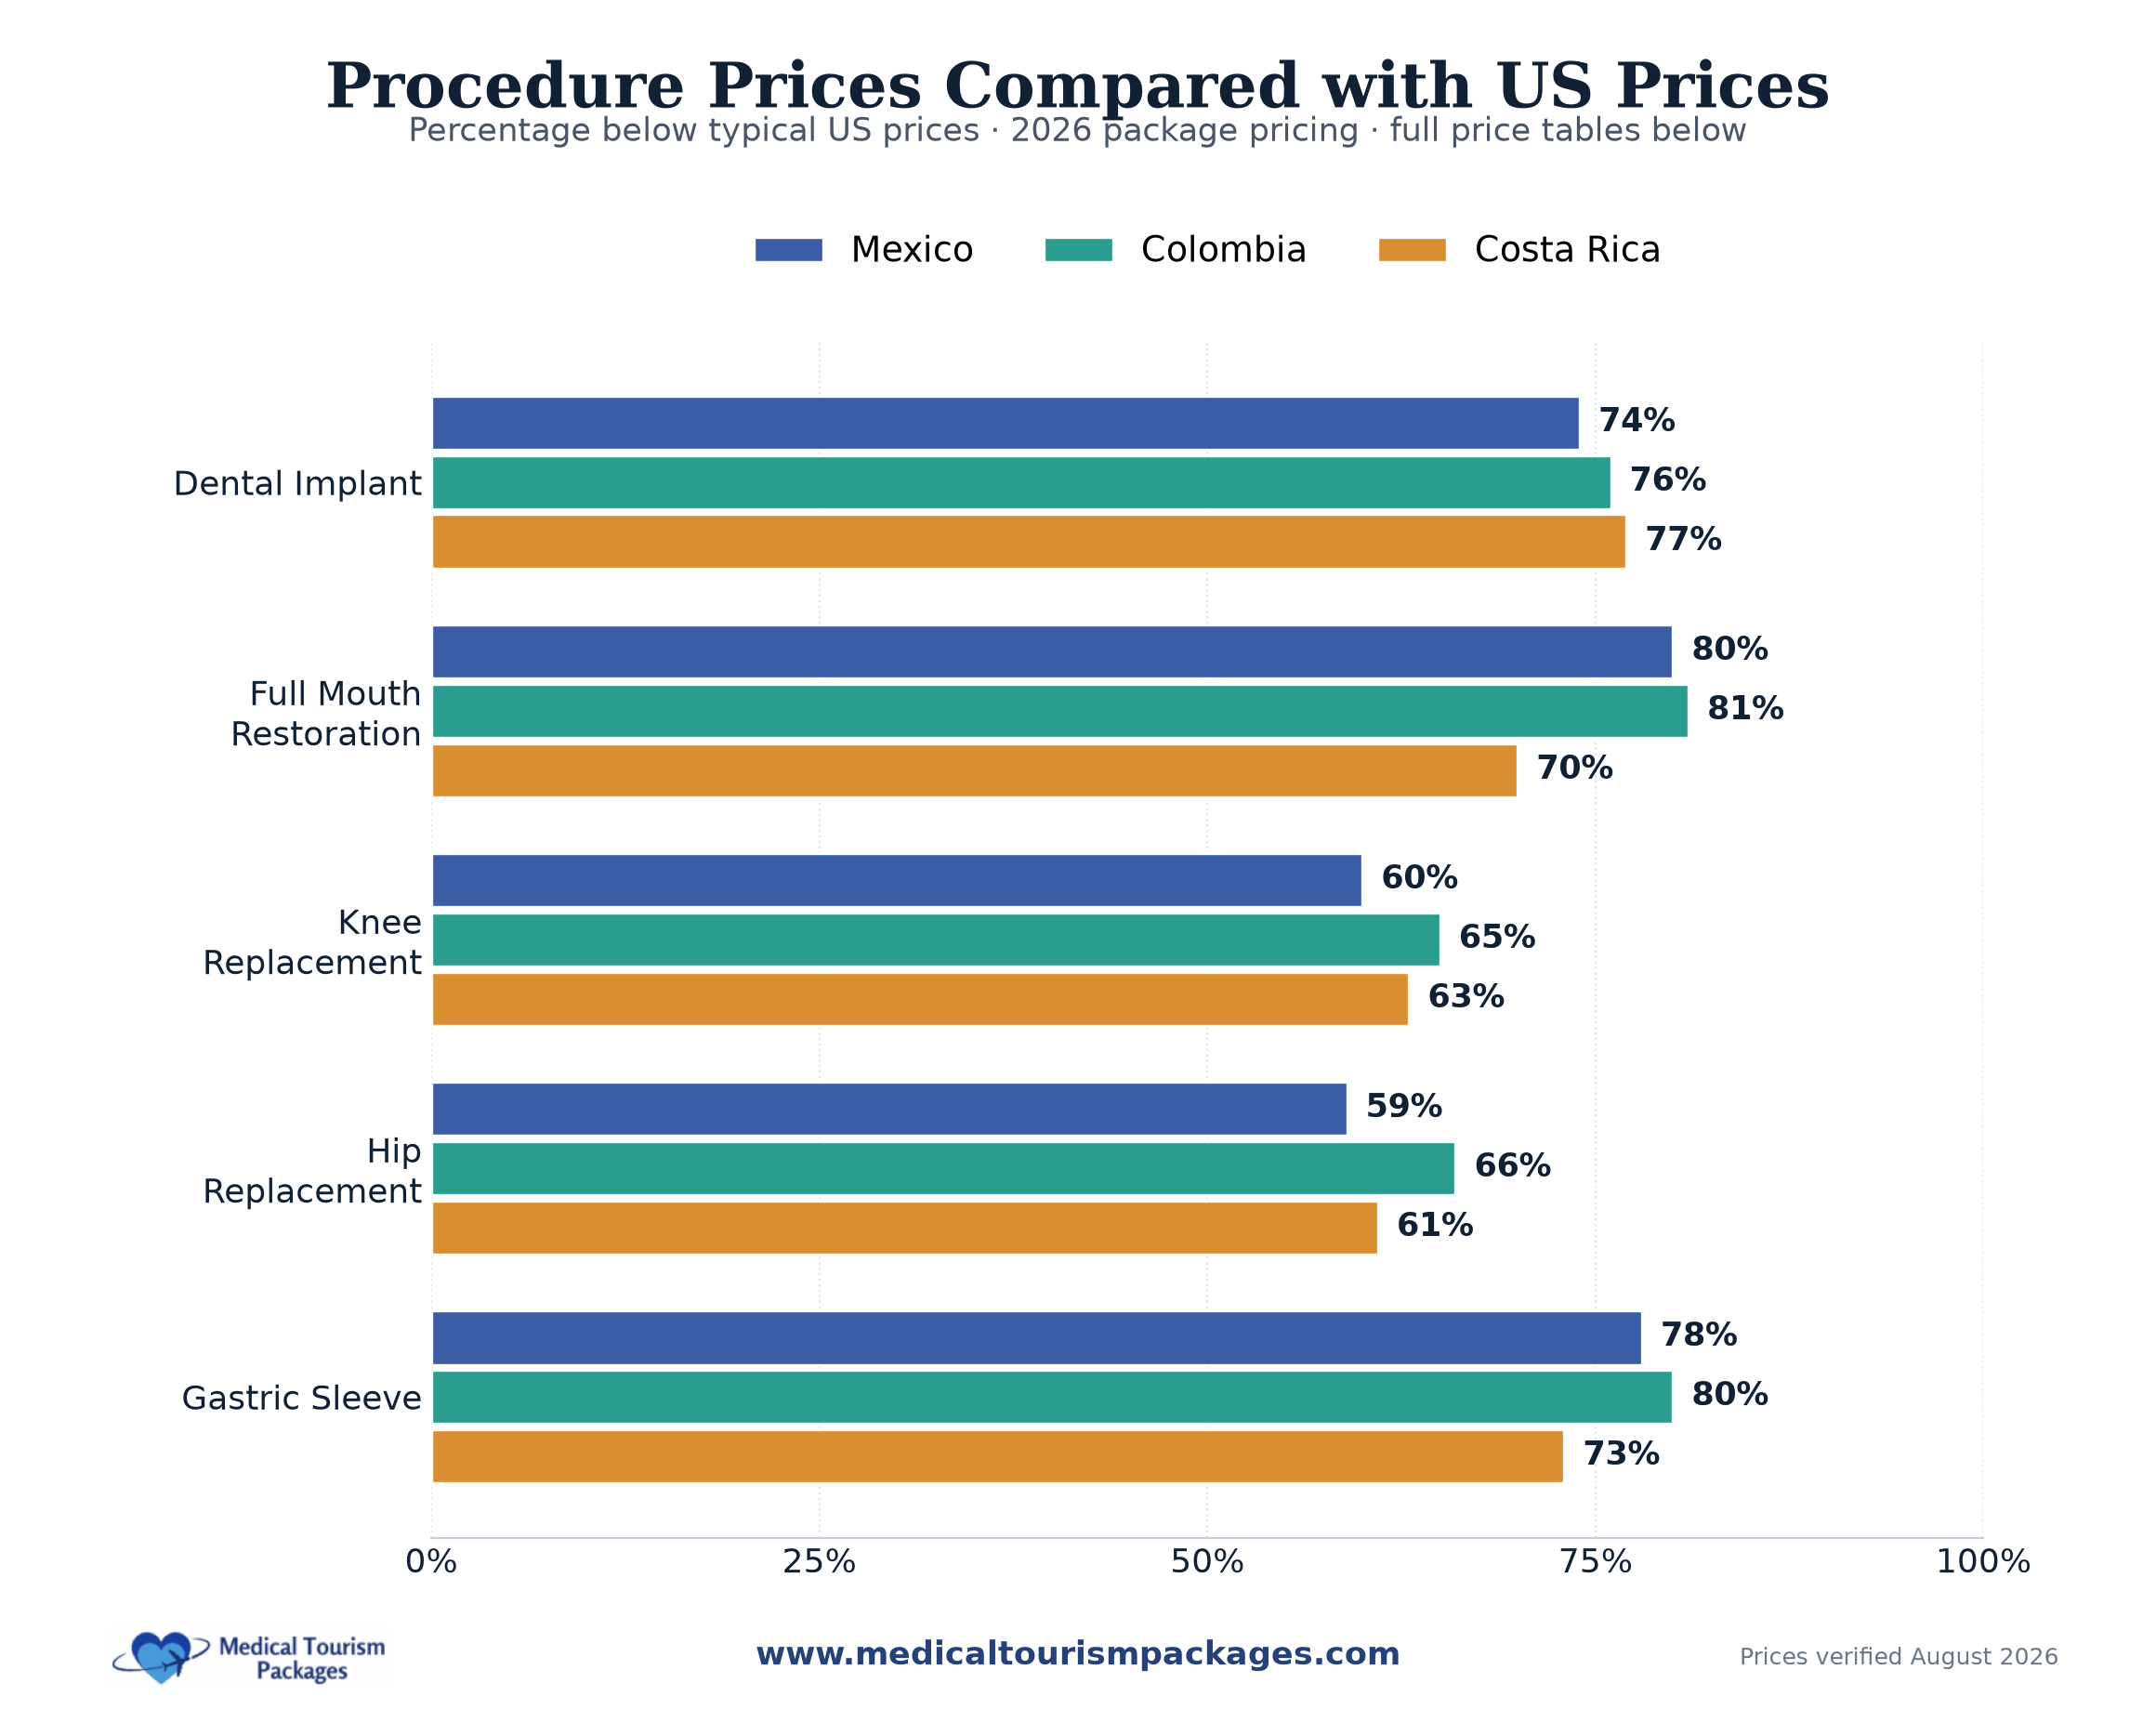
| Dental Implant | $3,500 | $900 | $850 | $800 | 70-77% |
| Root Canal | $1,200 | $300 | $280 | $250 | 75-79% |
| Full Mouth Restoration | $40,000 | $8,000 | $7,500 | $12,000 | 70-81% |
Dental implants are the most-travelled-for dental procedure in the region. Current pricing and clinic standards are detailed under dental implants in Latin America.
Cosmetic Surgery: 50-70% below US prices
| Procedure | USA Cost | Mexico | Colombia | Brazil | Below USA |
|---|---|---|---|---|---|
| Breast Augmentation | $8,000 | $3,200 | $2,800 | $3,500 | 56-65% |
| Rhinoplasty | $7,500 | $2,500 | $2,200 | $3,000 | 60-70% |
| Liposuction | $6,000 | $2,500 | $2,000 | $2,800 | 53-67% |
Major Medical/Surgical: 60-80% below US prices
| Procedure | USA Cost | Mexico | Colombia | Costa Rica | Below USA |
|---|---|---|---|---|---|
| Knee Replacement | $30,000 | $12,000 | $10,500 | $11,000 | 60-65% |
| Hip Replacement | $32,000 | $13,000 | $11,000 | $12,500 | 60-66% |
| Gastric Sleeve | $20,000 | $4,500 | $4,000 | $5,500 | 72-80% |
Joint replacement accounts for most orthopedic medical travel to the region. Hospital options and recovery timelines are listed under orthopedic surgery in Latin America.
Diagnostics & Preventative Screening: 64-84% below US prices
| Procedure | USA Cost | Latin America | Below USA |
|---|---|---|---|
| Full Body MRI | $2,499-3,999 | $400-1,000 | 64-84% |
| Executive Health Check (basic) | $1,750 | $600 | 66% |
| Executive Health Check (standard) | $5,250 | $1,200 | 77% |
| Executive Health Check (premium, includes full body MRI or CT) | $12,500 | $3,000 | 76% |
Screening is priced by package tier rather than by country, so this table shows the Latin America range. Scanner types and imaging-centre standards are covered under full body MRI in Latin America, and tier inclusions under executive health check in Latin America.
Patient Volume Statistics
Annual Inbound Medical Tourists:
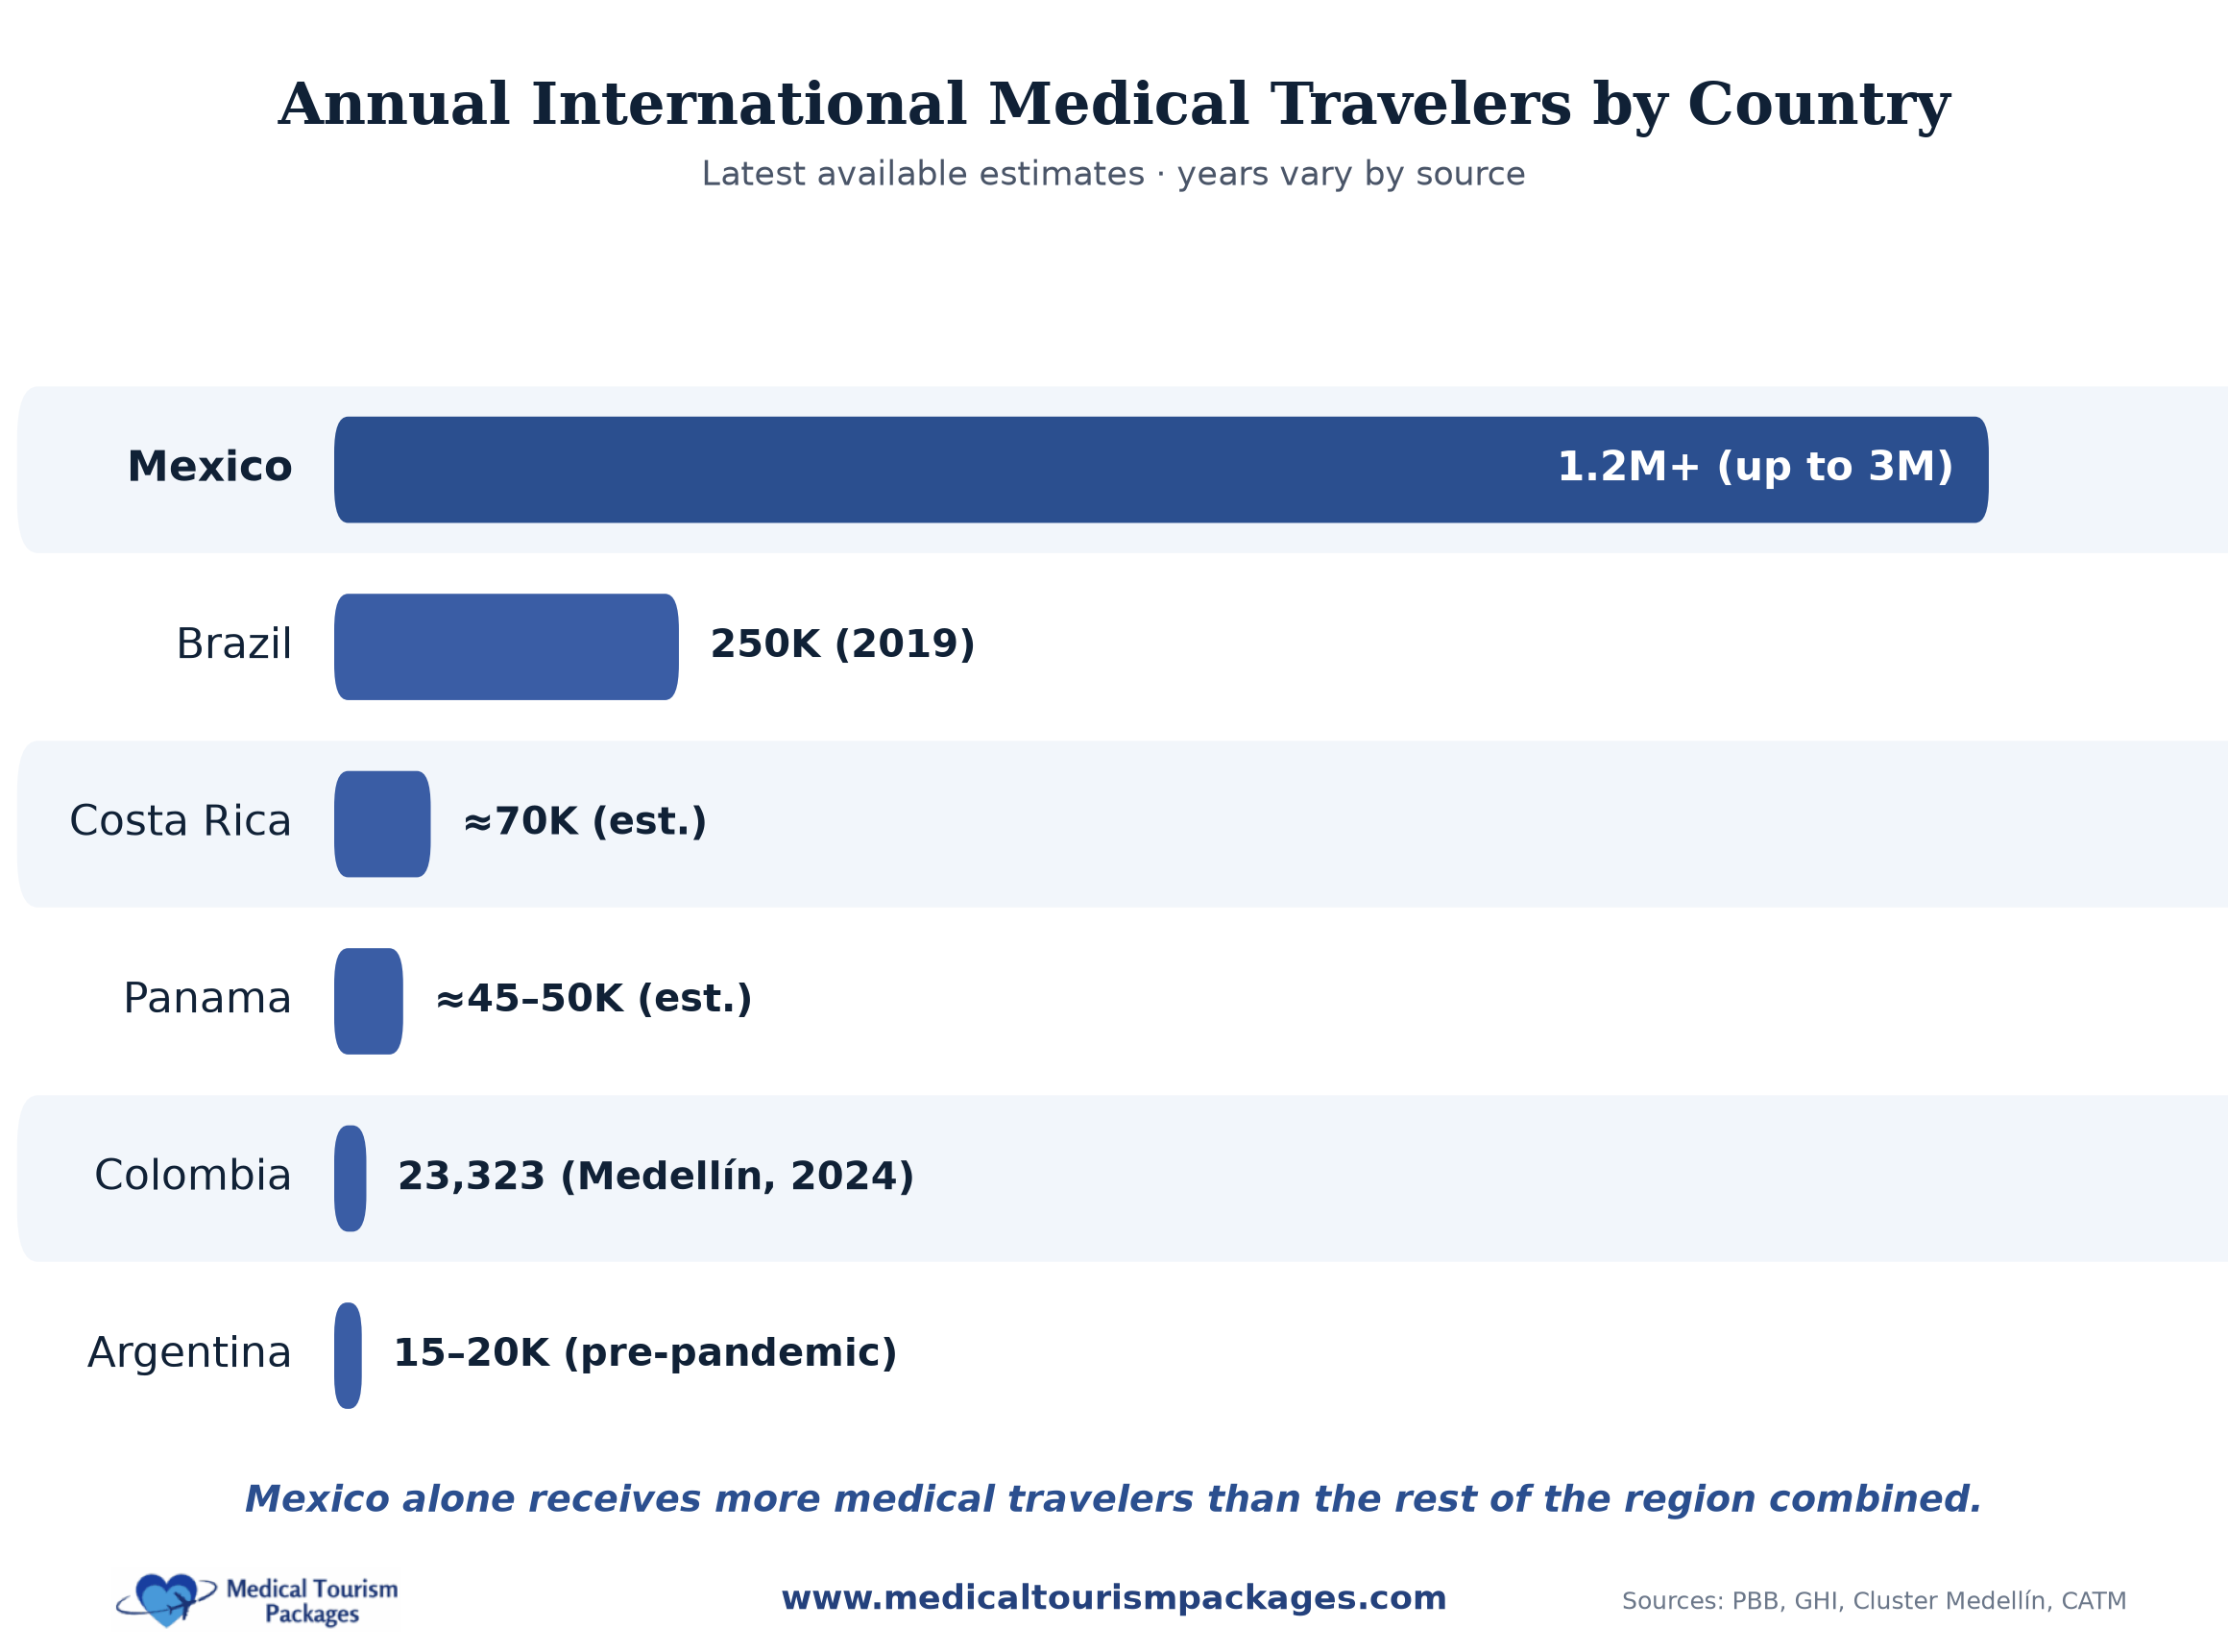
- Mexico: 1.2 to 3 million medical travelers a year, mostly from the United States (Global Health Intelligence; Patients Beyond Borders)
- Brazil: 180,000-250,000 medical tourists annually (2019 estimate); 8.2% of aesthetic patients come from abroad (ISAPS 2024)
- Colombia: 30% of aesthetic procedures are for foreign patients; 3rd most-used destination for plastic surgery worldwide (after Brazil and Turkey)
- Costa Rica: An estimated 70,000 medical tourists a year ($437 million in revenue in 2017, per PROMED and the Central Bank of Costa Rica); ranked #7 on the 2020-21 Medical Tourism Index
- Panama: Tens of thousands of medical tourists annually (dollarized economy, Johns Hopkins affiliation)
- Argentina: 15,000 to 20,000 medical travelers a year pre-pandemic (Argentine Medical Tourism Chamber)
Patient Demographics:
- Age 40–60: Largest patient segment (primary demographic for medical procedures)
- Age 25–39: Primary cosmetic surgery demographic
- Age 55–69: Primary orthopedic and cardiac surgery demographic
- Age 70+: Critical care and complex procedure demographic
Origin Markets:
- North America: About 90% of Costa Rica’s medical tourists (80% USA, 10% Canada)
- Europe: Secondary source market (Argentina receives high European volume)
- Intra-regional: Colombia attracts patients from Ecuador, Panama, Caribbean
- Other regions: Limited volume from Asia and other continents
Quality & Accreditation Statistics
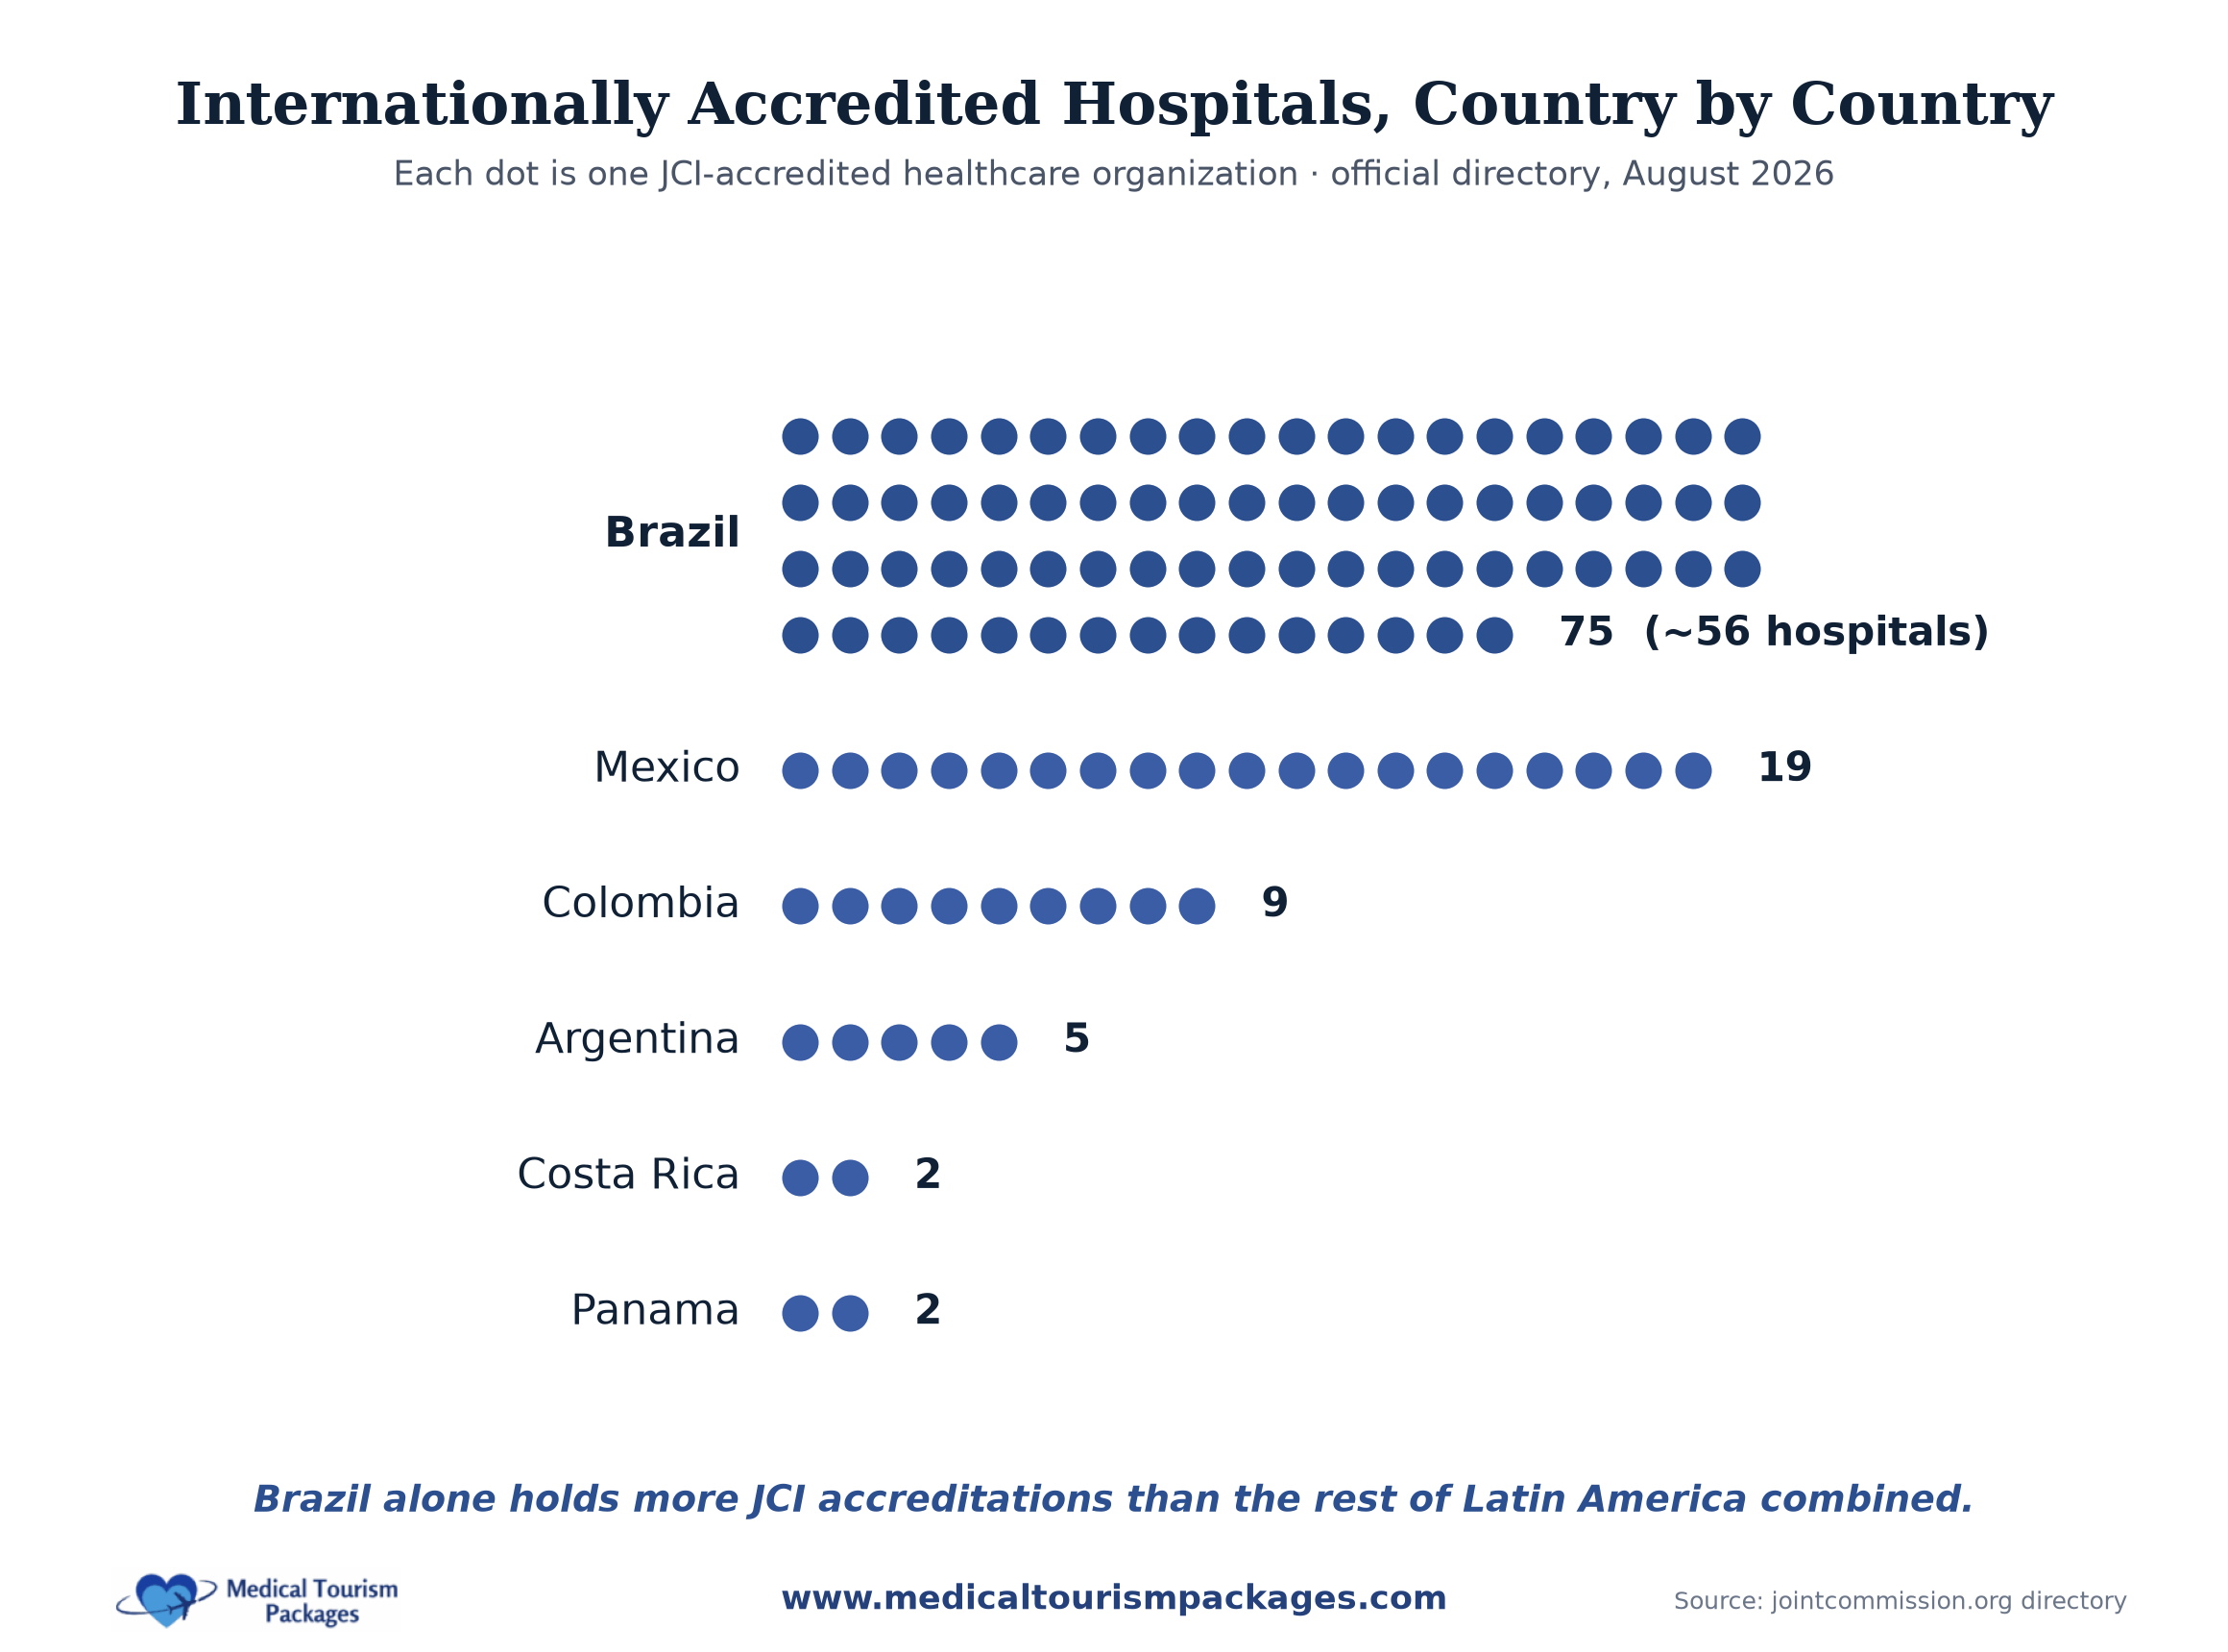
JCI (Joint Commission International) accreditation is the most widely recognised international standard for healthcare facilities. Here’s how Latin America compares (counts from the official JCI directory, August 2026):
JCI-Accredited Facilities by Country:
- Brazil: 75 JCI-accredited organizations, about 56 of them hospitals, the highest in Latin America (Joint Commission International directory, August 2026)
- Mexico: 19 facilities (including Médica Sur, a Mayo Clinic Care Network member)
- Colombia: 9 JCI-accredited facilities (Joint Commission International directory, August 2026); Medellín received 23,323 international patients in 2024, 15% compound annual growth since 2010 (Cluster Medellín)
- Costa Rica: 2 facilities (Hospital CIMA, Clínica Bíblica)
- Panama: 2 facilities (Pacífica Salud with Johns Hopkins affiliation)
- Argentina: 5 facilities (including Hospital Universitario Austral and Hospital Italiano de Buenos Aires)
Patient Safety & Satisfaction:
- Colombia: 98.2% of 460 international plastic surgery patients said they would recommend their clinic to friends and family (Campbell et al., PRS Global Open, 2020)
- Historical context: the WHO’s last global health-system ranking, published in the 2000 World Health Report, placed Colombia 22nd, the United States 37th and Canada 30th. No comparable WHO ranking has been published since, so this is a historical reference point rather than a current measure of quality.
- Costa Rica: Dental implants show a 96.4% ten-year survival rate in peer-reviewed research
- Brazil: First JCI accreditation outside the US, Hospital Albert Einstein in 1999 (9.7% of GDP on healthcare, World Bank 2023)
- Regional Average: 48% positive safety culture score (2022 systematic review)
Recovery Tourism & Innovation Statistics
The future of medical tourism lies in comprehensive care ecosystems and technological innovation:
Telemedicine Growth:
- Latin America telemedicine market: $3.46 billion in 2026, projected $12.34 billion by 2034
- Growth rate: 17.23% CAGR (2026 to 2034)
- Post-op care solution: Remote monitoring addresses continuity gap
Technology Investment:
- Robotic surgery market: $2.62 billion across Latin America by 2027
- AI diagnostics: Brazil registered first AI-powered endoscopic device (2024)
- 3D printing: Custom implants and surgical guides expanding across regional orthopedic and dental practices
Recovery Tourism:
- Costa Rica: Combines medical treatment and wellness recovery in the same trip
- Specialized facilities: Post-op retreats with professional nursing
- Market positioning: Operators package post-operative recovery and accommodation alongside the procedure
Future Projections & Market Outlook
Strategic forecasts and growth projections for the Latin American medical tourism market through 2035:
Growth Projections by Country:
- Colombia: Target 2.8M health tourists, $6.3B revenue by 2032
- Brazil: $17.5B market by 2034 (18.14% CAGR)
- Mexico: $10.6B by 2034 (18.96% CAGR for medical tourism)
- Regional Total: $58.38B by 2034 (18.9% CAGR)
Market Risks & Challenges:
- Post-operative care gap: 48% safety culture score indicates system weakness
- Legal recourse: Limited malpractice protection for international patients
- Quality variance: Risk of unregulated “garage clinics” in Mexico
- Currency sensitivity: Market vulnerable to USD strength
Detailed Procedure Statistics & Success Rates
Comprehensive statistics on the most popular medical tourism procedures across Latin America:
Cosmetic Surgery: Brazil’s Global Ranking
- Brazil: #1 worldwide in surgical aesthetic procedures with 2.35 million in 2024, #2 in total procedures with 3.1 million (ISAPS); liposuction leads at 289,766 procedures
- Colombia: 3rd most-used destination for plastic surgery worldwide (30% of procedures for international patients, ranked 13th for plastic surgeons globally)
- Would recommend: 98.2% of surveyed patients would recommend their clinic (Colombia plastic surgery study, 2020)
- Market Value: $6.5 billion South America cosmetic surgery market (2024), projected $10.2 billion by 2035
Bariatric Surgery: Mexico’s Specialization
- Mexico: Bariatric surgery costs $4,000-7,000 for a gastric sleeve, versus $15,000-25,000 in the USA
- Cost difference: Gastric sleeve $4,000-7,000 vs. $15,000-25,000 USA (77% below US prices)
- Success Rate: 95%+ success rate at JCI-accredited facilities
- Patient Profile: 40-60% USA patients, primarily uninsured/underinsured Americans
Frequently Asked Questions
How much can you save with medical tourism in Latin America?
Patients from the United States typically pay 40% to 80% less than at home. The difference reaches 82% on full-mouth dental restoration, and a gastric sleeve runs $4,000 to $7,000 in Mexico versus $15,000 to $25,000 in the USA.
Is healthcare in Latin America safe and accredited?
Joint Commission International (JCI) accreditation is the most widely recognised international standard. Brazil has 75 JCI-accredited organizations, Mexico has 19, and Colombia has 9 (official JCI directory, August 2026). In the WHO’s last global health-system ranking (World Health Report 2000), Colombia placed 22nd, ahead of the United States at 37th.
Which country is best for which procedure?
Brazil and Colombia lead in cosmetic surgery, Mexico specializes in bariatric and dental work, Costa Rica is known for dental care and wellness recovery, and Panama offers US-affiliated care through hospitals such as Pacífica Salud.
How many people travel to Latin America for medical care each year?
Mexico receives 1.2 to 3 million medical travelers a year, Brazil 180,000 to 250,000, and Costa Rica and Panama each welcome tens of thousands more (industry estimates).
How fast is the Latin American medical tourism market growing?
The market is projected to grow from $14.61 billion in 2026 to $58.38 billion by 2034, an 18.9% compound annual growth rate.
What are the main risks of medical tourism?
The most cited risks are gaps in post-operative care continuity, limited malpractice recourse for international patients, quality variance among unregulated clinics, and exposure to currency fluctuations.
Ready to Explore Medical Tourism Options?
Get personalized recommendations and cost estimates for your medical procedure in Latin America.